Sighting Analysis

Every checklist you've ever submitted, ready to explore.

eBird is built for collecting and sharing sightings across the global birding community. Yearbirder helps you explore your own personal sightings in depth — through sortable lists, totals, more than 30 chart types, and more than a dozen interactive maps, all filtered any way you choose.

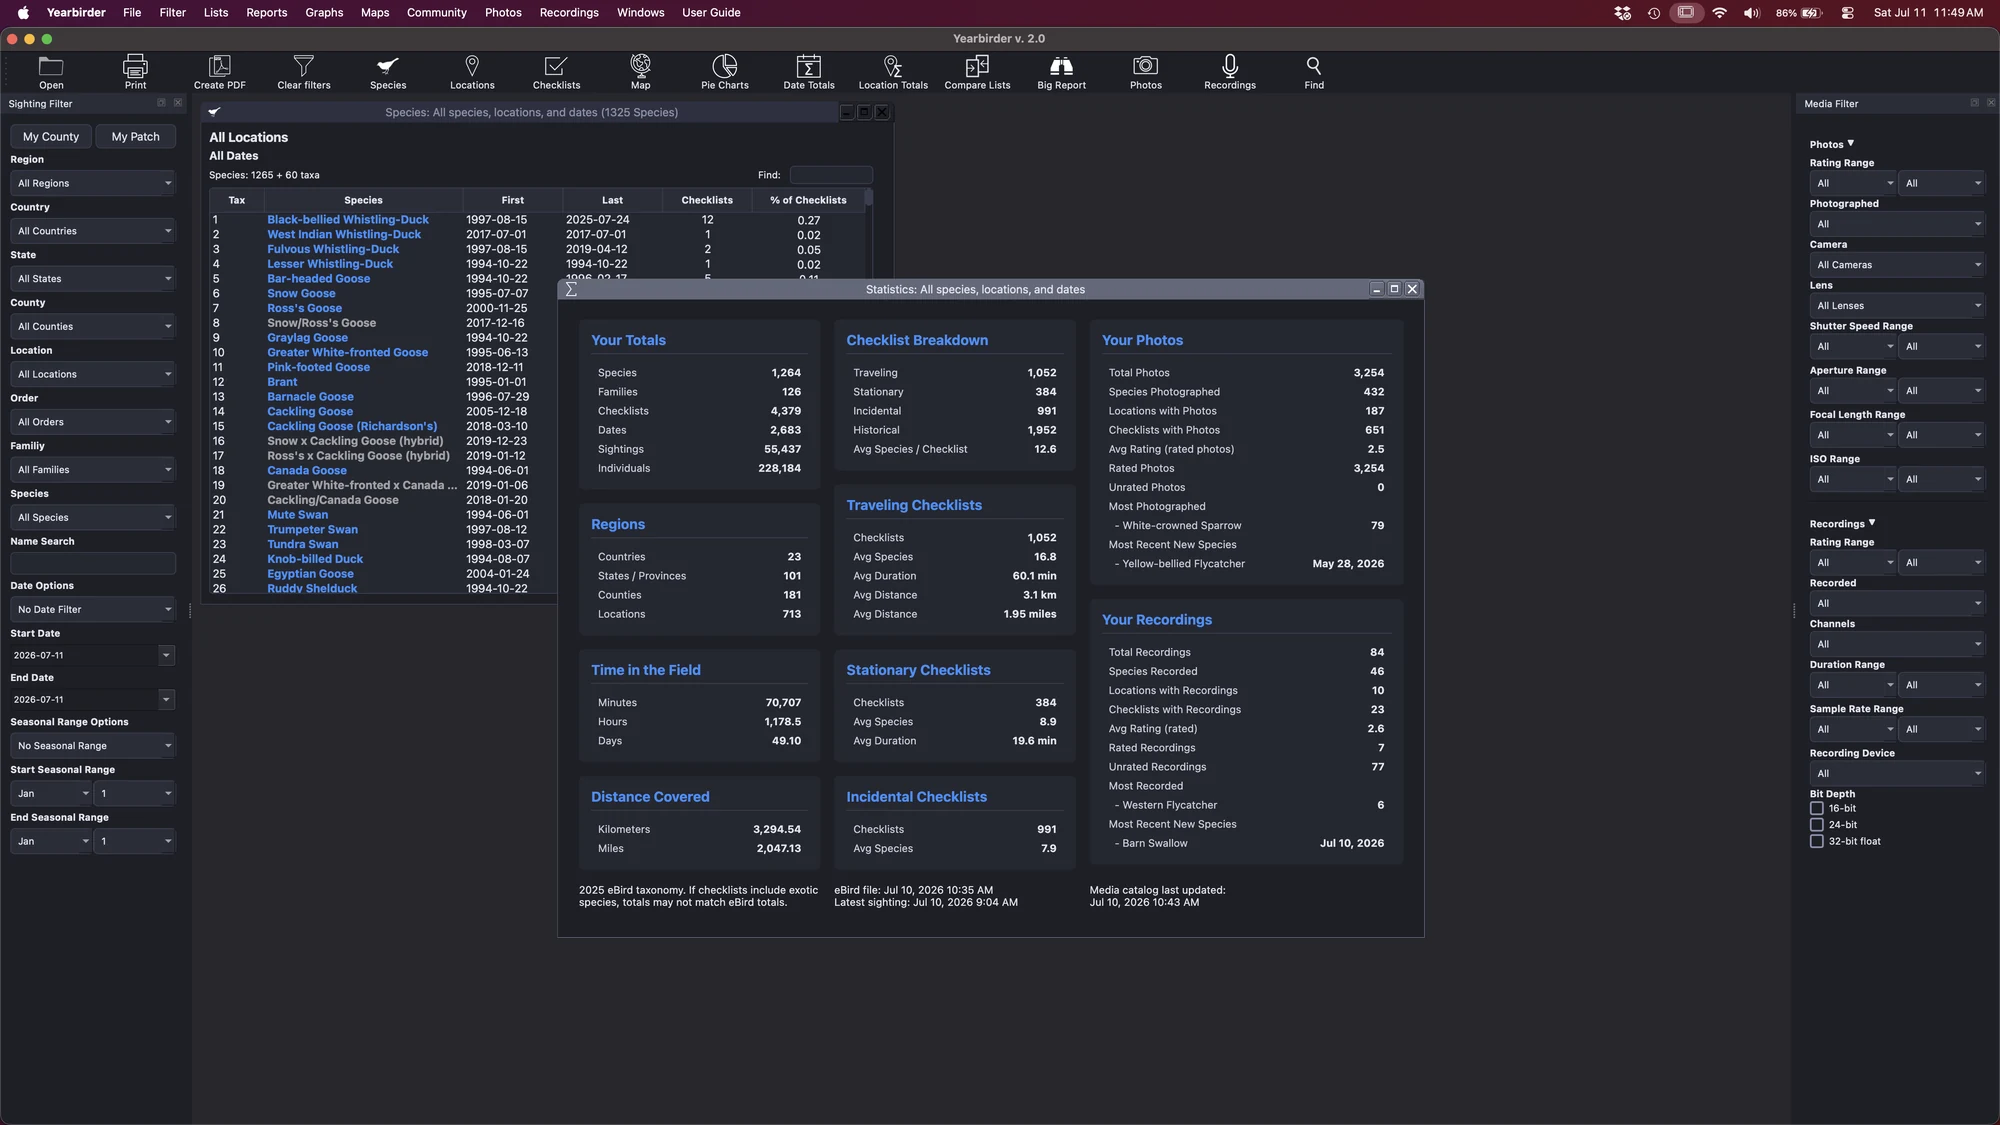
The Yearbirder main window with the Sighting Filter and a species list

The main window: set a filter once, then open any list, chart, or map from it.

Lists for every question you can ask

You can generate any variety of lists: county lists, state lists, date lists, lists of checklists, lists of locations — all filterable however you see fit. Create custom lists, like every sparrow you've seen on an April day in San Francisco County between 2008 and 2017, or a list of every location where you've seen a Western Kingbird.
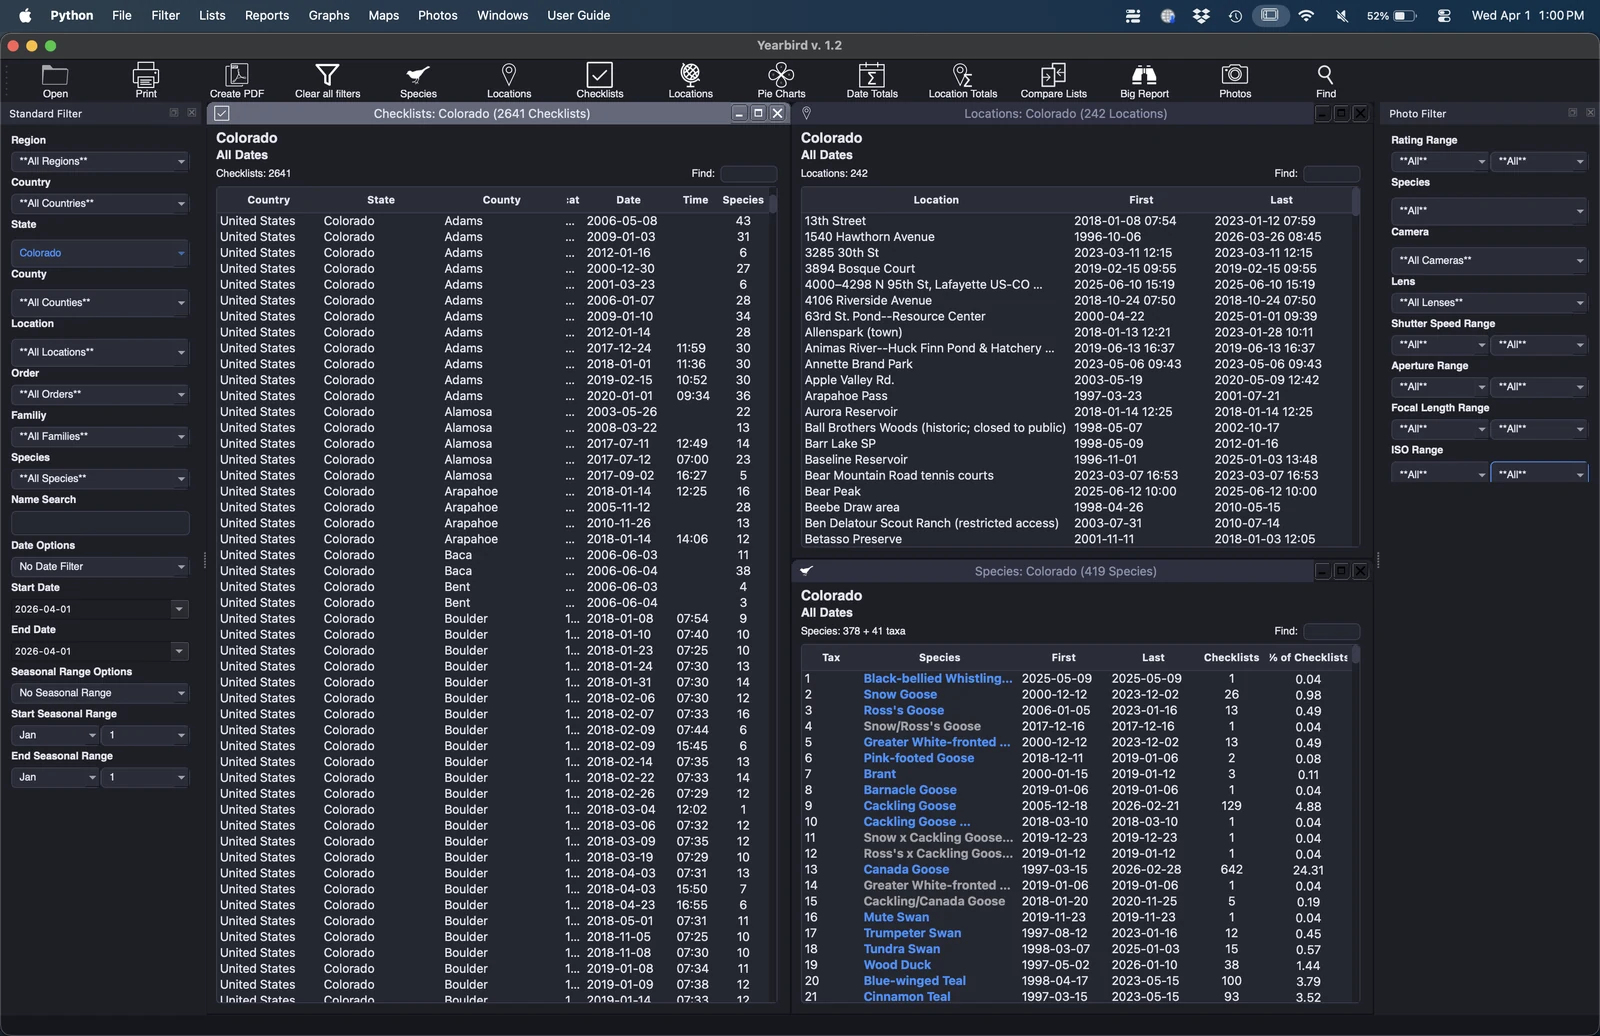
  • Filter simultaneously by region, family, species, date range, and season
  • Compare any two species lists side by side
  • Sort any table by any column instantly
  • Individual species window with full sighting history and monthly patterns
  • Location window with complete history, yearly breakdown, and a map
Yearbirder species list with sortable columns and media icons

Totals and the Big Report

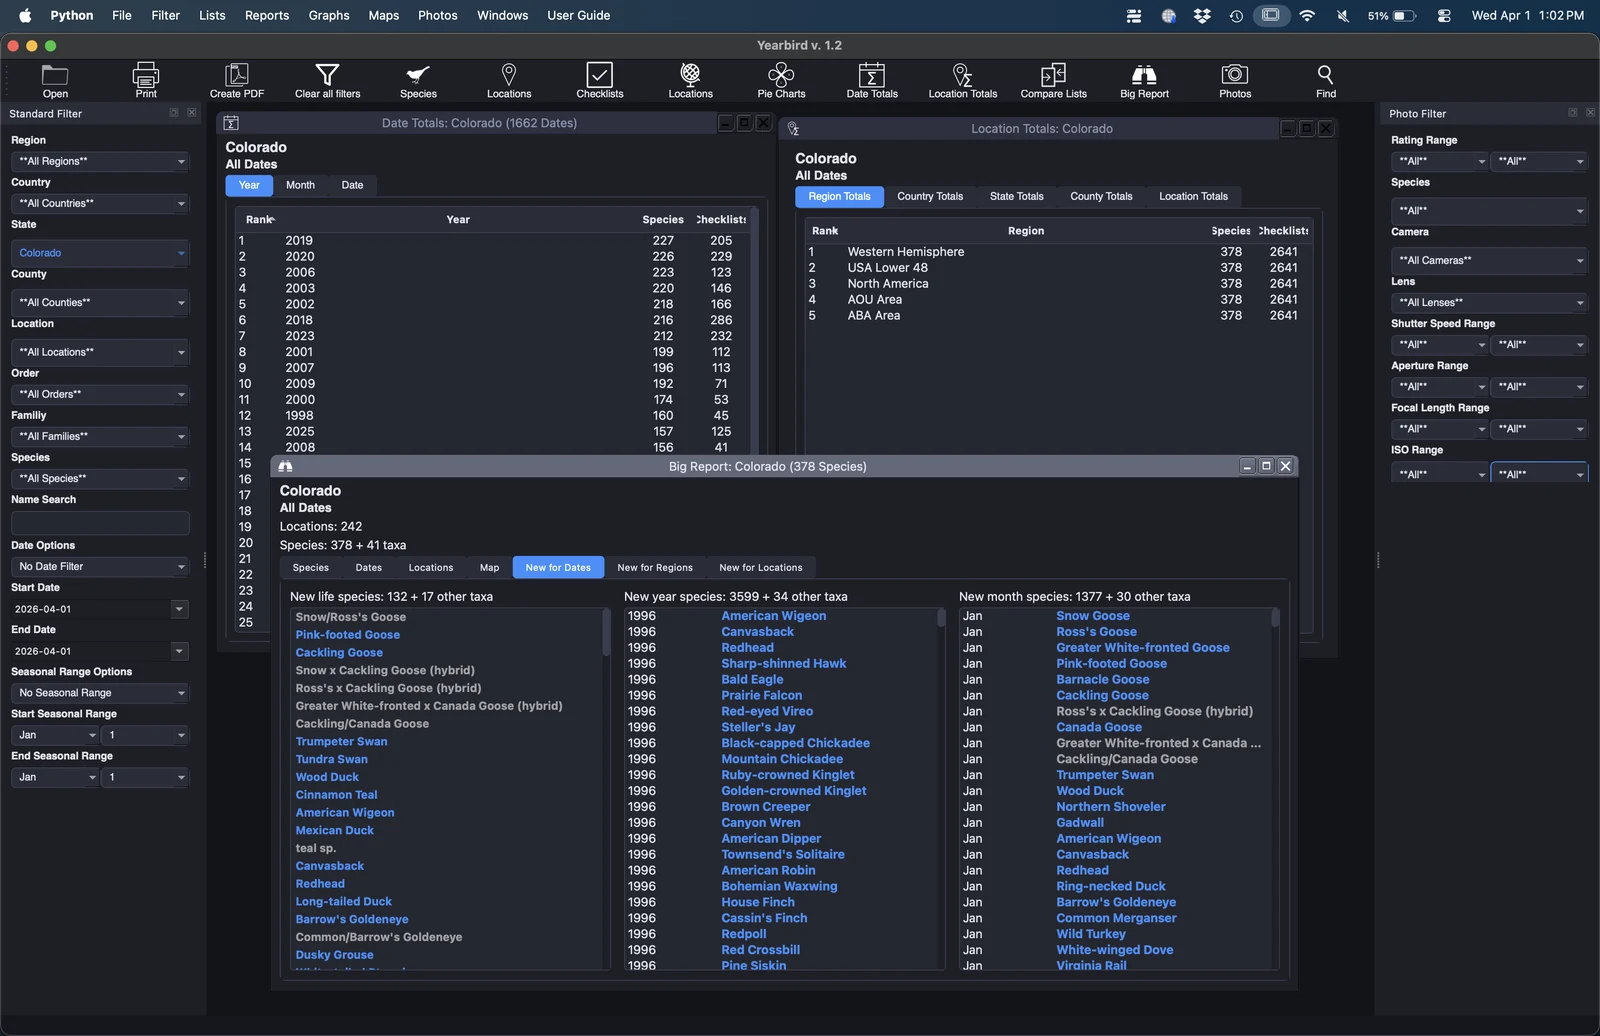
Date Totals shows your species counts by year, month, and individual date. Location Totals breaks down your counts by region, country, state, county, and named location. The Big Report pulls it all together in a tabbed view — species, dates, locations, and checklists at once.
  • Date Totals by year, month, and day
  • Location Totals by region, country, state, county, and location
  • The Big Report — species, dates, locations, and checklists in one tabbed view
  • Drill from any total straight into the underlying sightings
Yearbirder Date Totals, Location Totals, and Big Report windows

More than 30 chart types that reveal the big picture

Numbers alone don't tell the story. Yearbirder turns your data into charts that make patterns visible at a glance — from how fast you found new species each year to which locations dominate your checklist count.
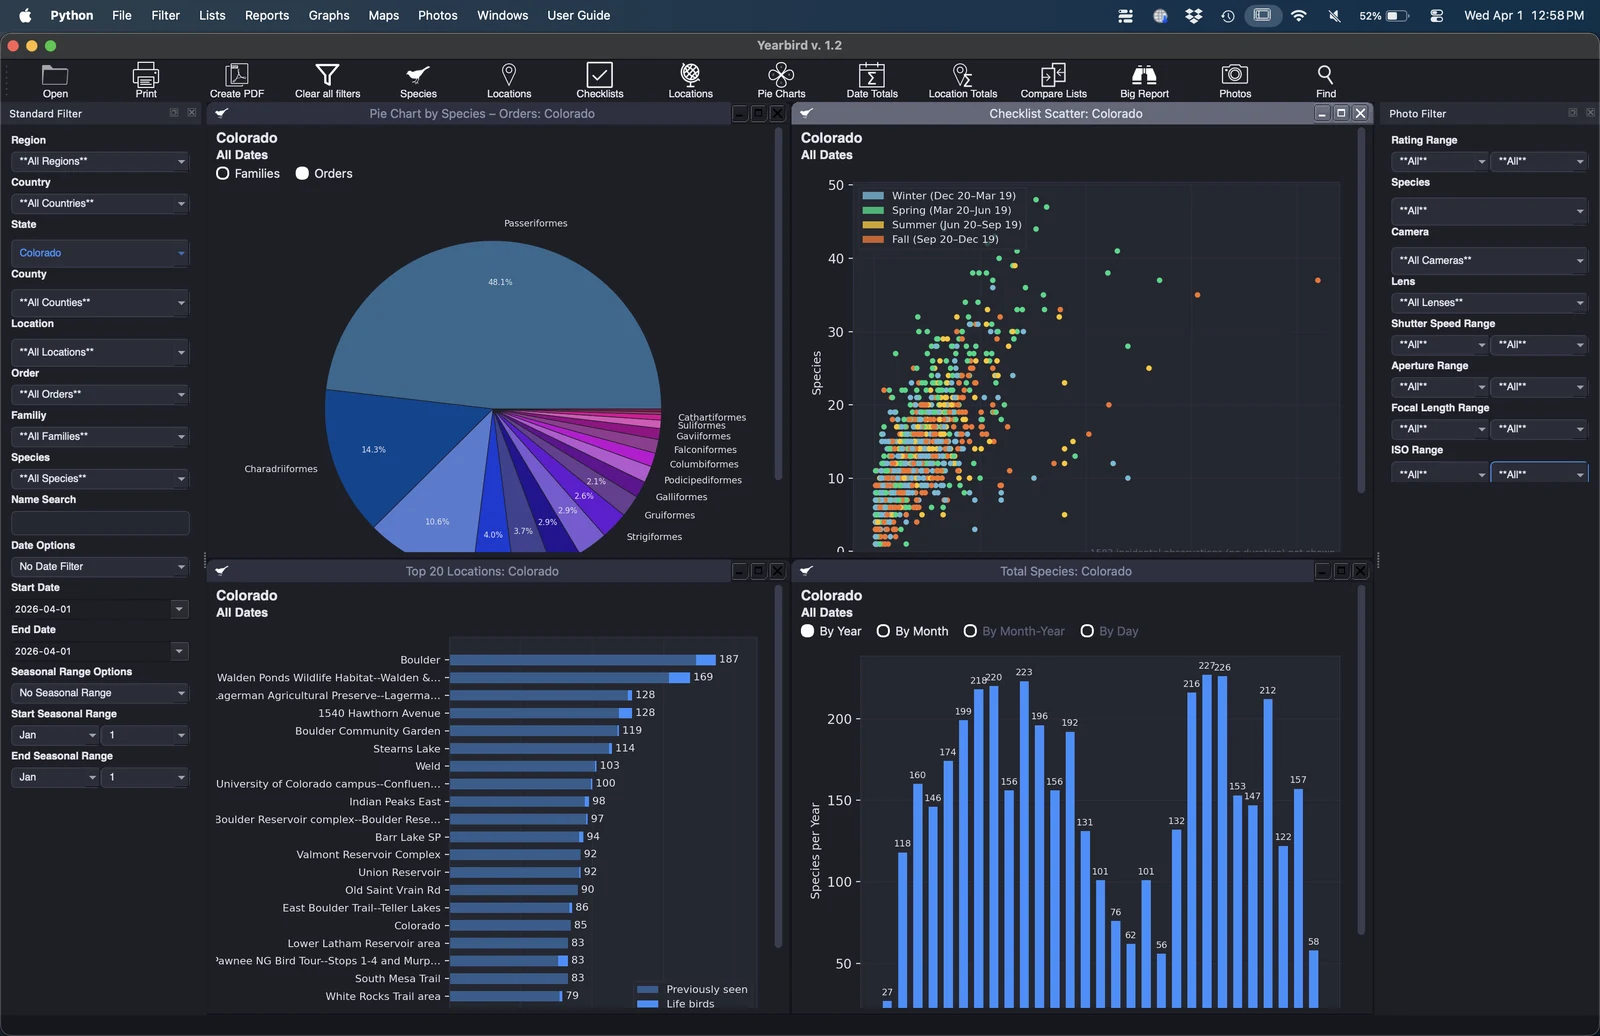
  • Species bar graphs, accumulation curves, and heatmaps
  • Top-20 locations by species count
  • Checklist scatter plots by duration and season
  • Phenology chart — sighting dates plotted by day of year
  • First and last sighting of each species per year
  • Year-to-date bar charts comparing every year side by side
  • Pie charts by family, order, or location
Yearbirder charts: species bar chart, pie chart, scatter plot, and YTD comparison

More than a dozen interactive maps of your birding world

See where you've been, how long you've spent there, and what you've found. Every map is zoomable and pannable, generated from your own eBird data.
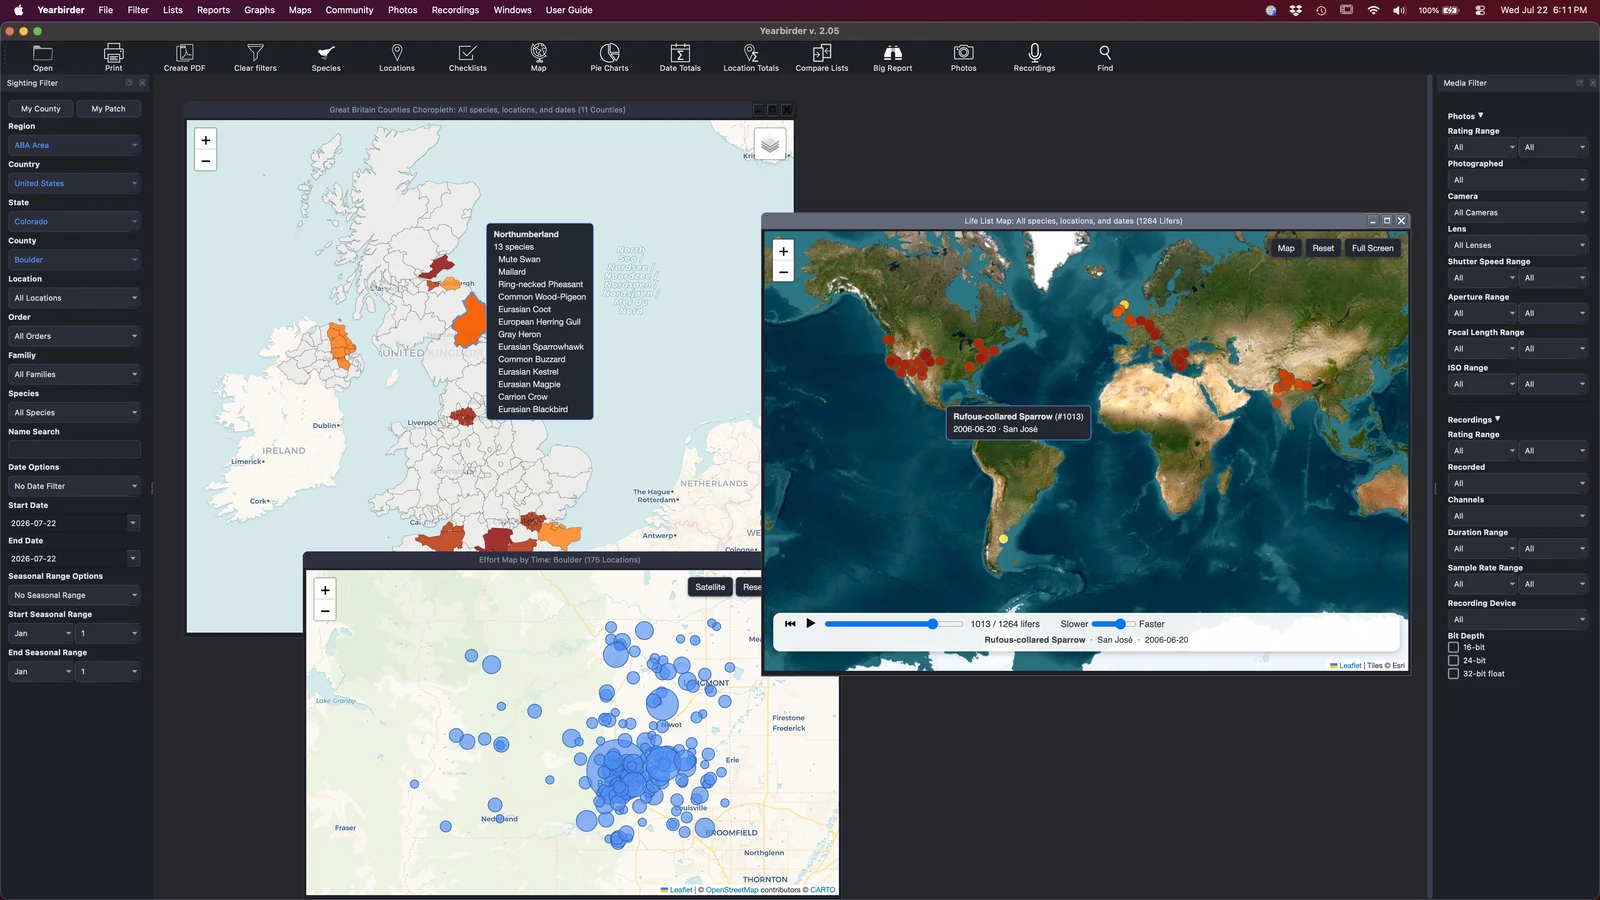
  • All sighting locations plotted on a global zoomable map
  • Animated lifer map — watch your life list build dot by dot
  • First-sightings map of where you first found each species
  • Effort maps sized by time spent or checklists submitted
  • Bubble maps sized by species count or individual tallies
  • Choropleth maps shading US states, US counties, Canada, India, Great Britain, and world countries by species or checklist count
  • Hotspot maps of the birding locations around you
Yearbirder interactive maps: life list map, choropleth, and bubble map

Explore your own sightings

Free and open-source, for macOS, Windows and Linux.